Field Note: Making Maps Using GIS
By Raine LeBlanc (they/them), North Coast Project Assistant
Thanks to CalTrout, I spent 2020 traveling around the world. I even spent a little time in outer space!
My journey started in summer 2019 when my boss, Darren Mierau, Director of CalTrout’s North Coast Region, casually asked me if I wanted to learn GIS. Sure, I replied, figuring I’d teach myself GIS in a couple of weeks online with some YouTube videos and simple tutorials. After all, I had worked in graphic design and page layout before coming to CalTrout, so how hard could mapmaking be?
It didn’t take long for me to figure out that Geographic Information Sciences are an entire discipline that includes not only cartography/graphic design but also more than a little math and science. I needed more structure to do this right. Fortunately, CalTrout stepped up with support from the Resource Legacy Fund (RLF) to support staff development in GIS, and I signed up for the Online Geospatial Certificate course through Humboldt State University, a 5-course minor in GIS taught entirely remotely.
The coursework started in January and ends just about as you are reading this. I have been privileged in this terrible year to have this great escape, to delve into and out of this world from the comfort of my living room. The coursework has covered areas as diverse as research methods, data access and evaluation, electromagnetic energy and satellite remote sensing, the history of navigation, cultural critiques of the discipline, and cartography (my favorite).
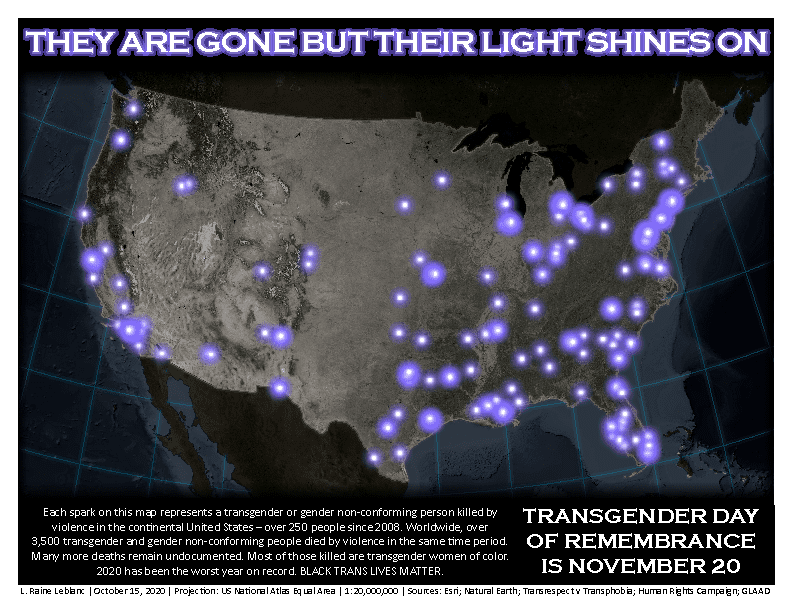
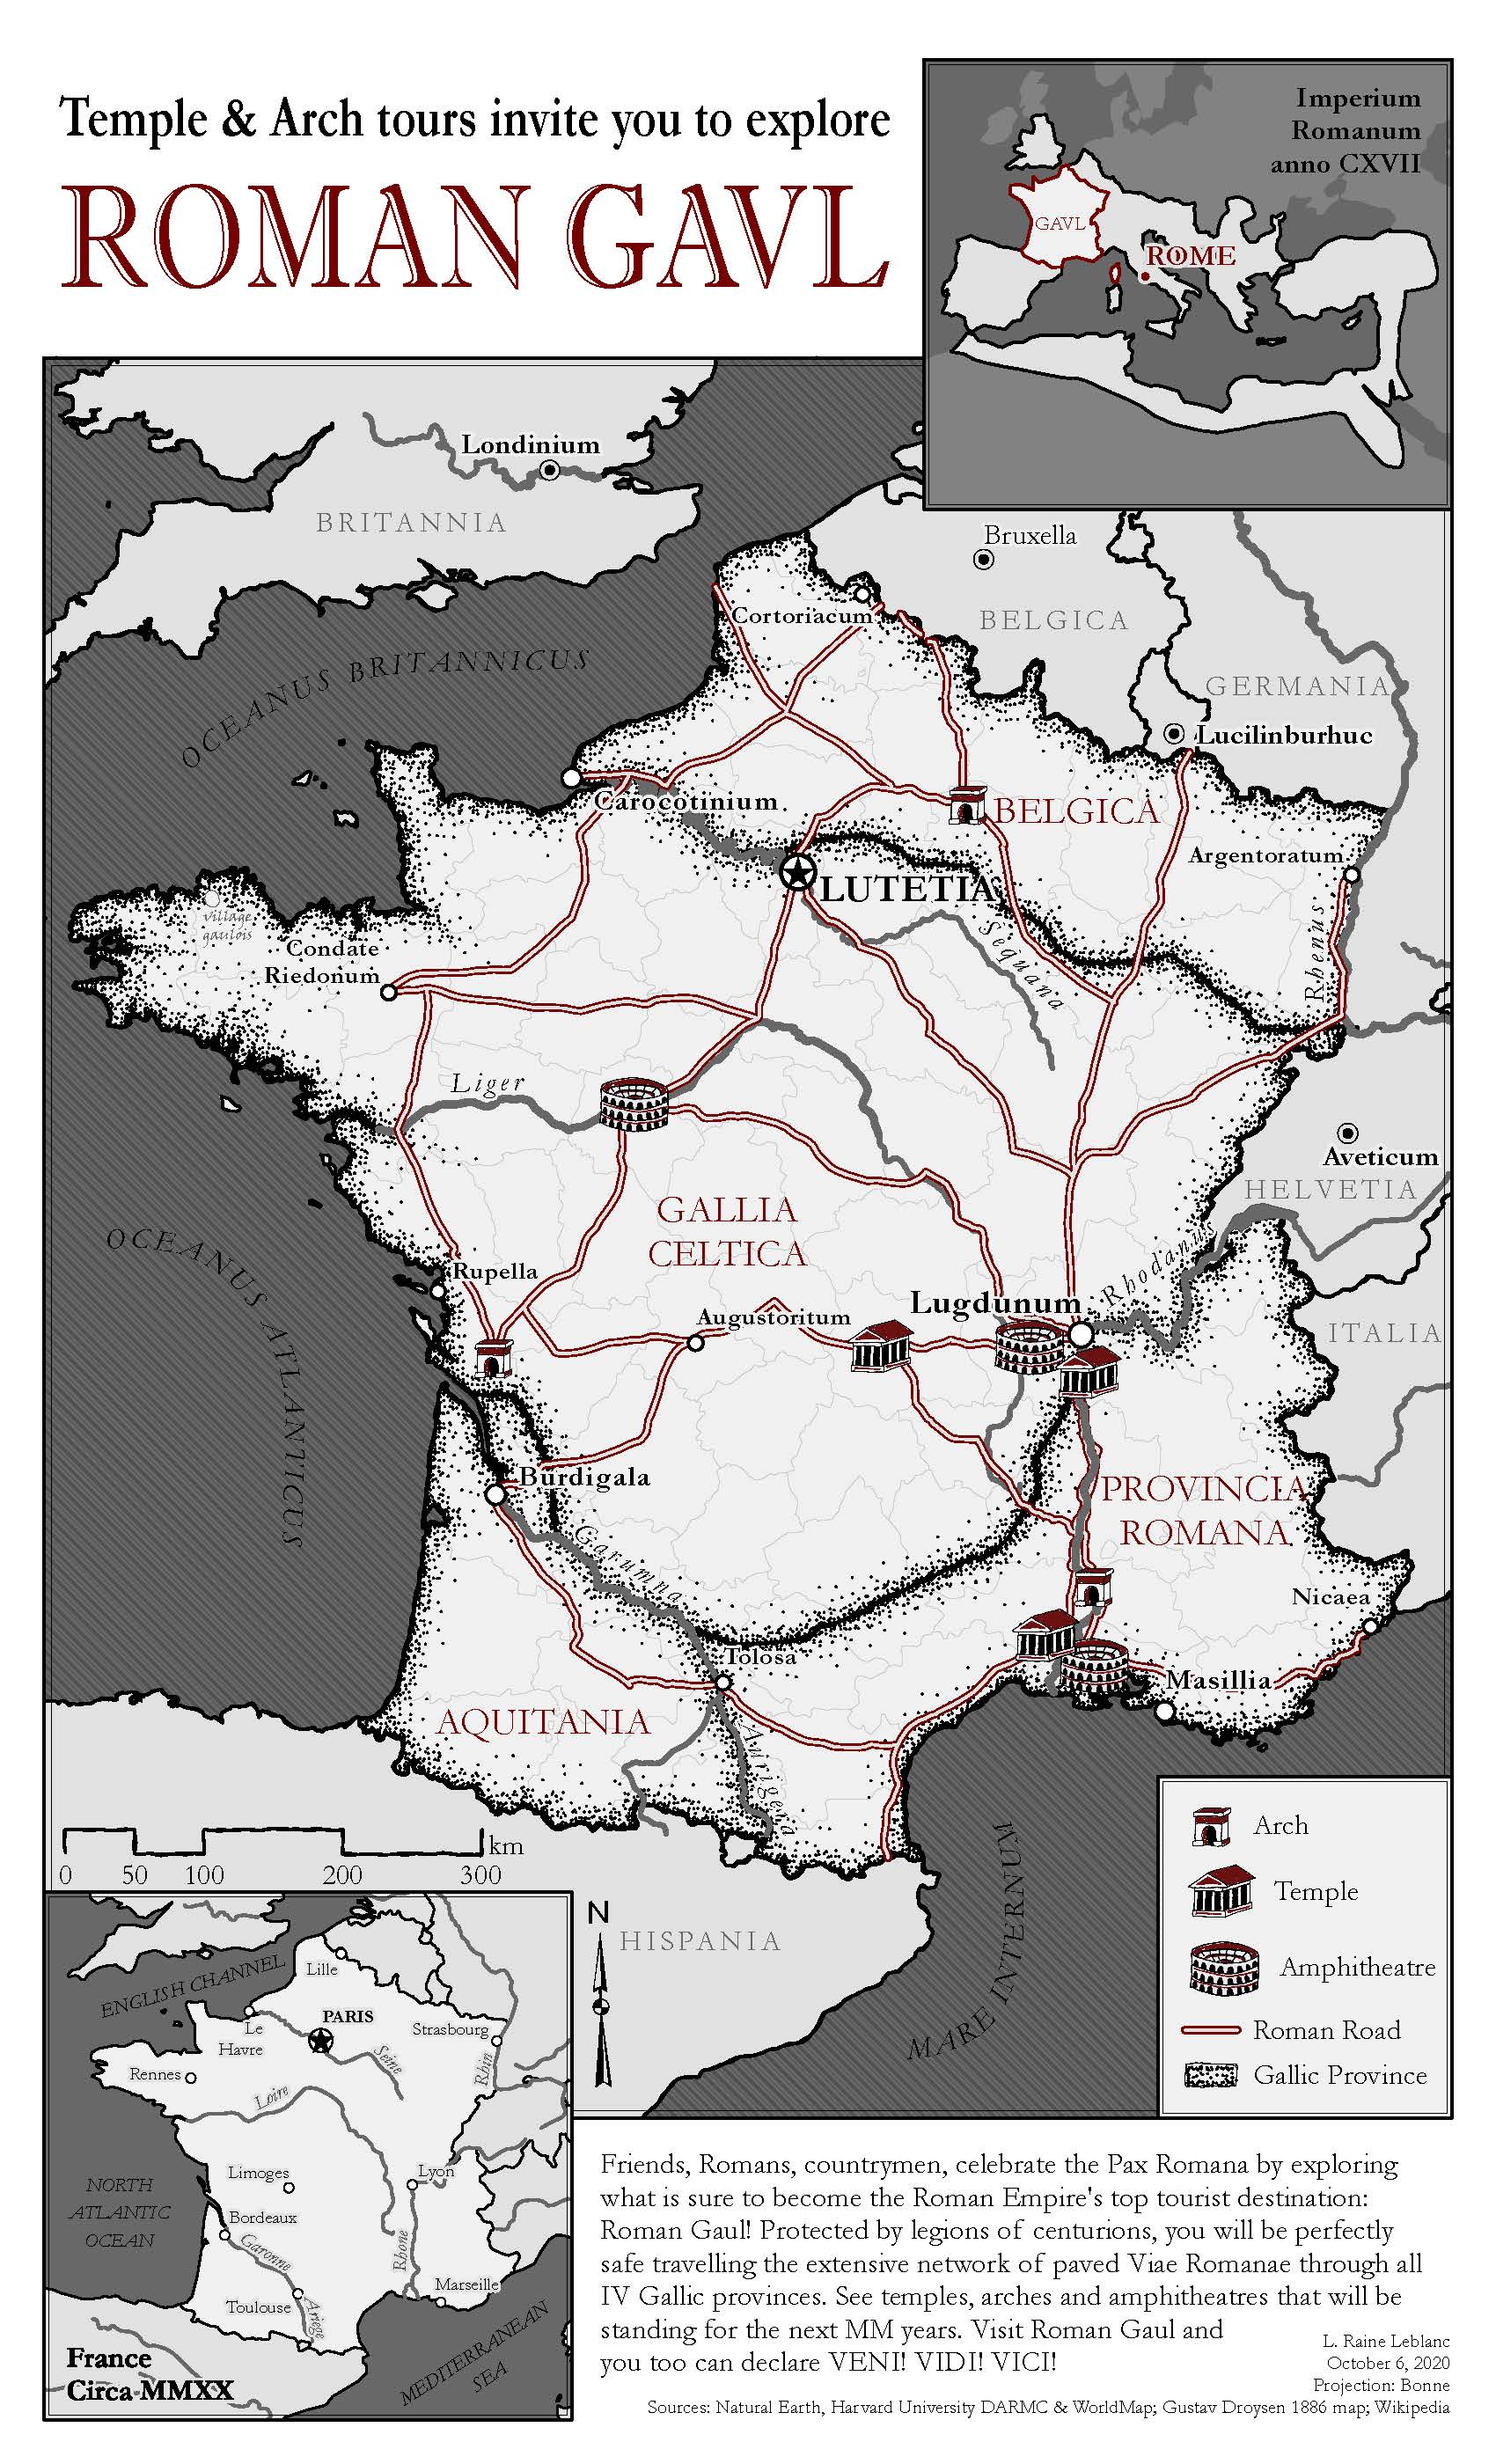
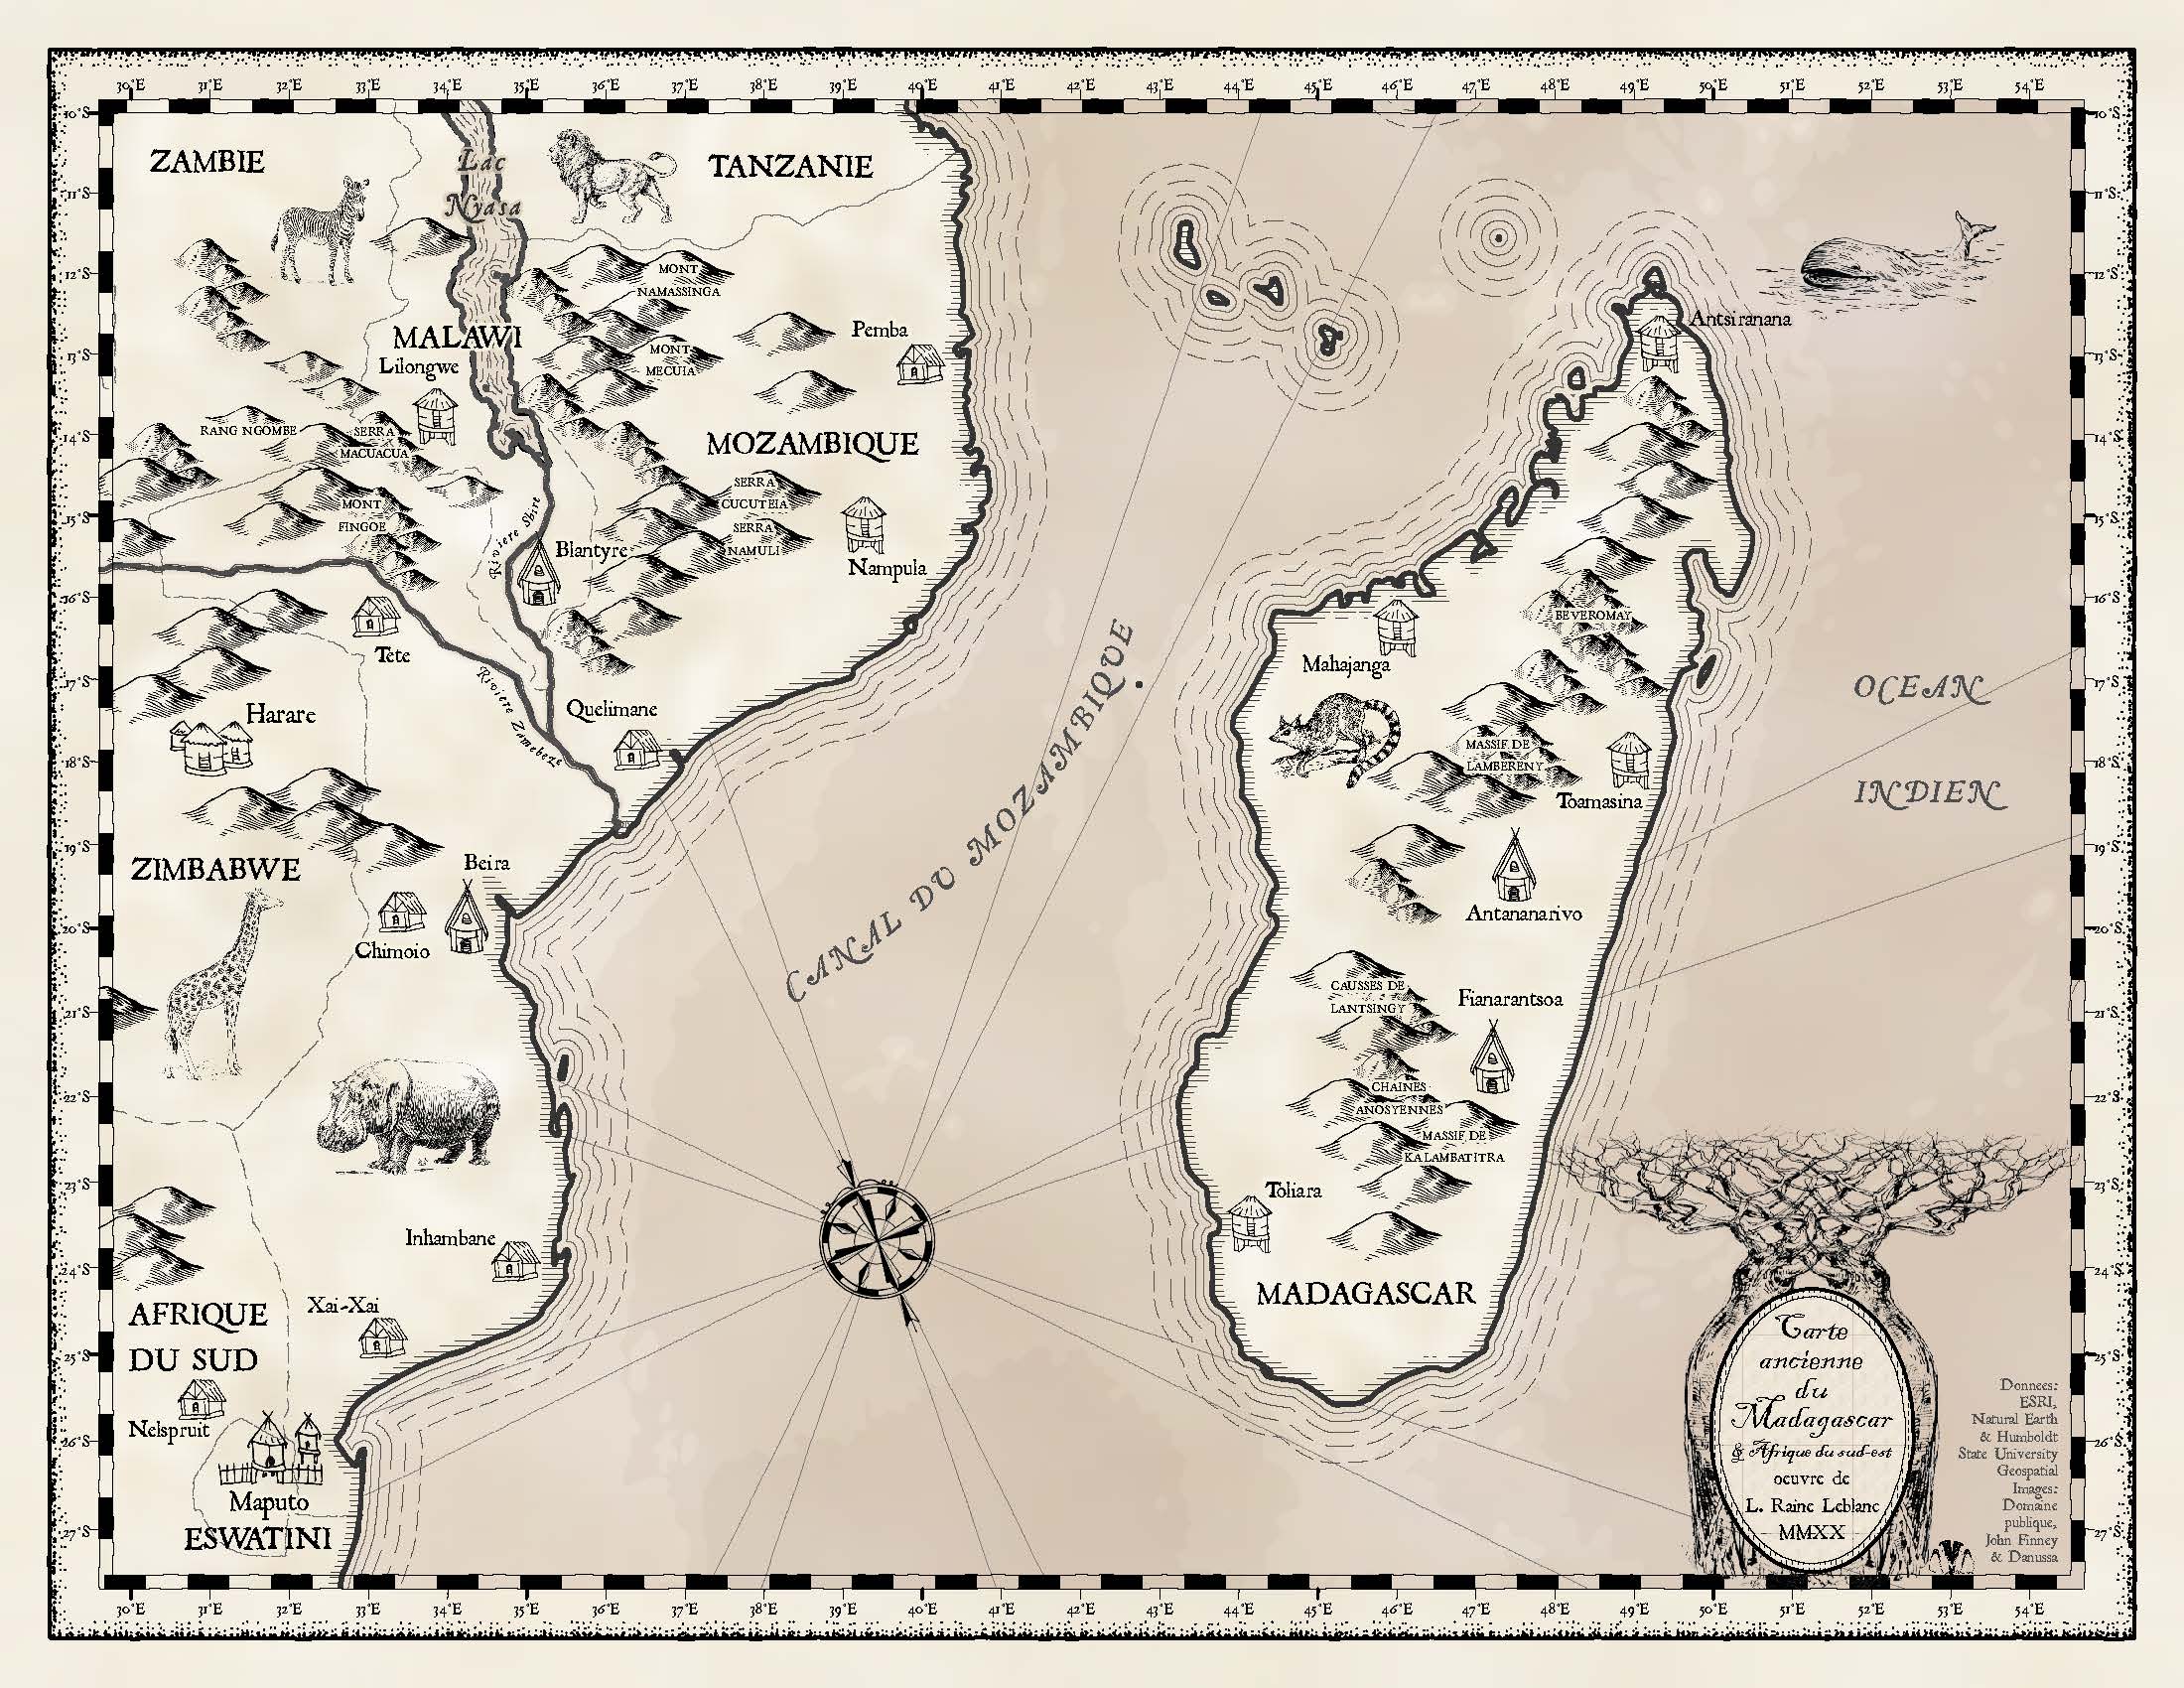
In the past year, I’ve mapped animal migration paths, evaluated Los Angeles County crime hotspots, selected optimal homesteading sites, plotted garbage truck routes, promoted tourism of ancient Gaul, made faux antique maps of Madagascar, and memorialized murder victims.
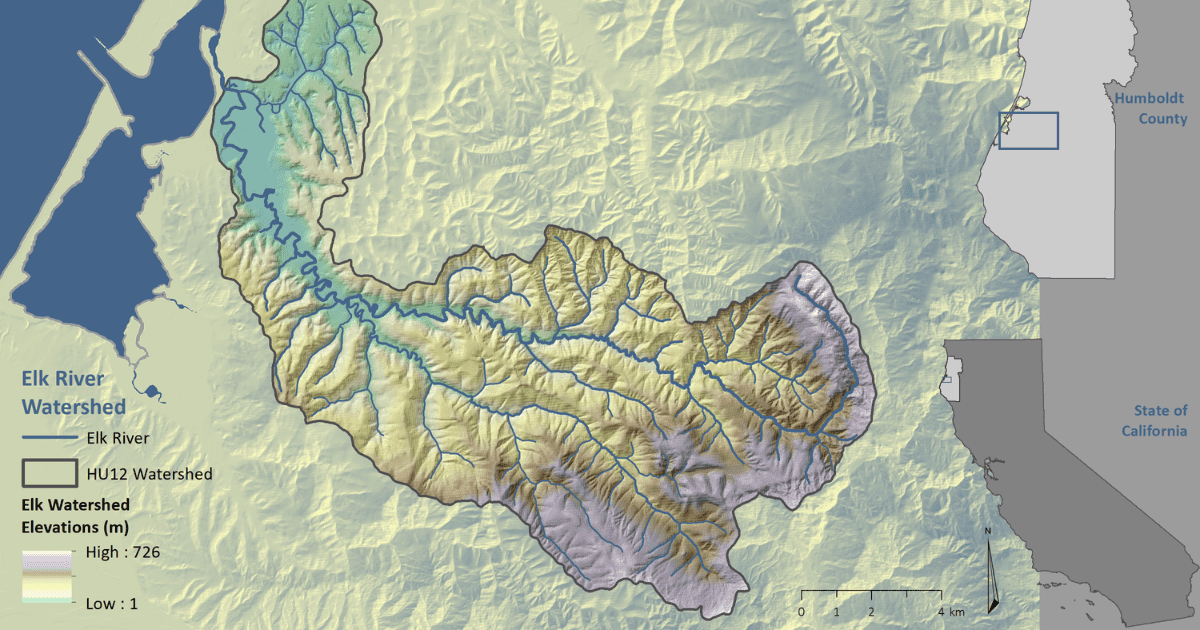
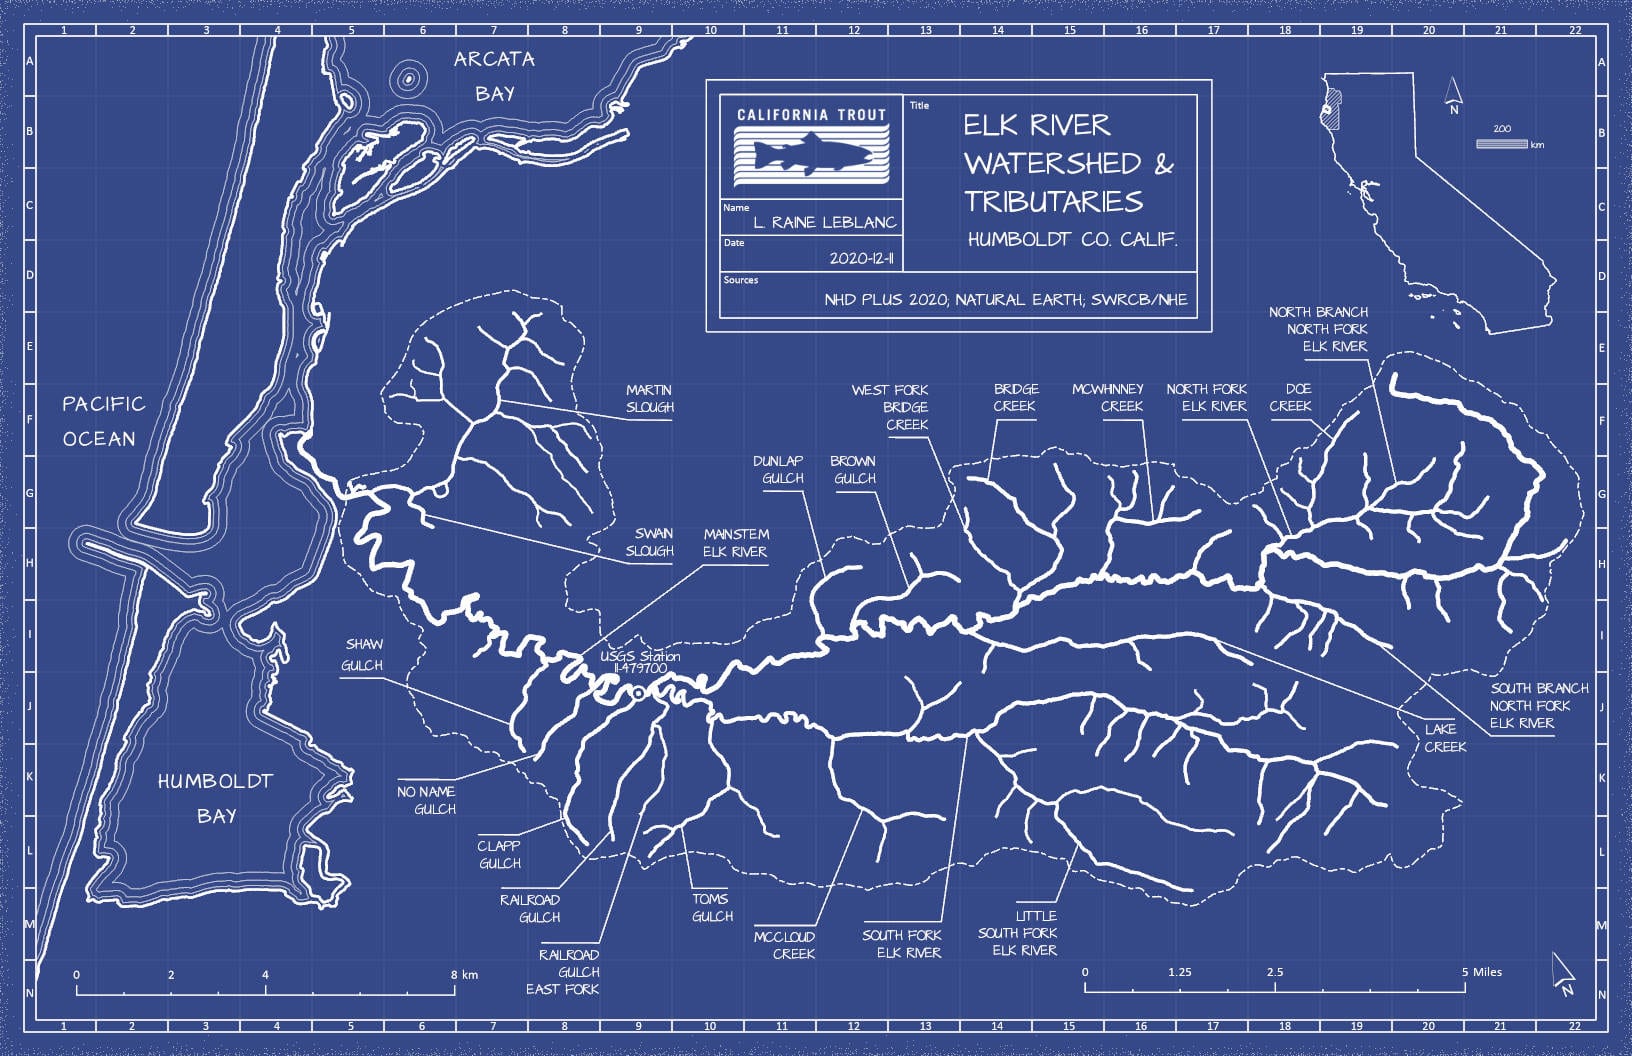
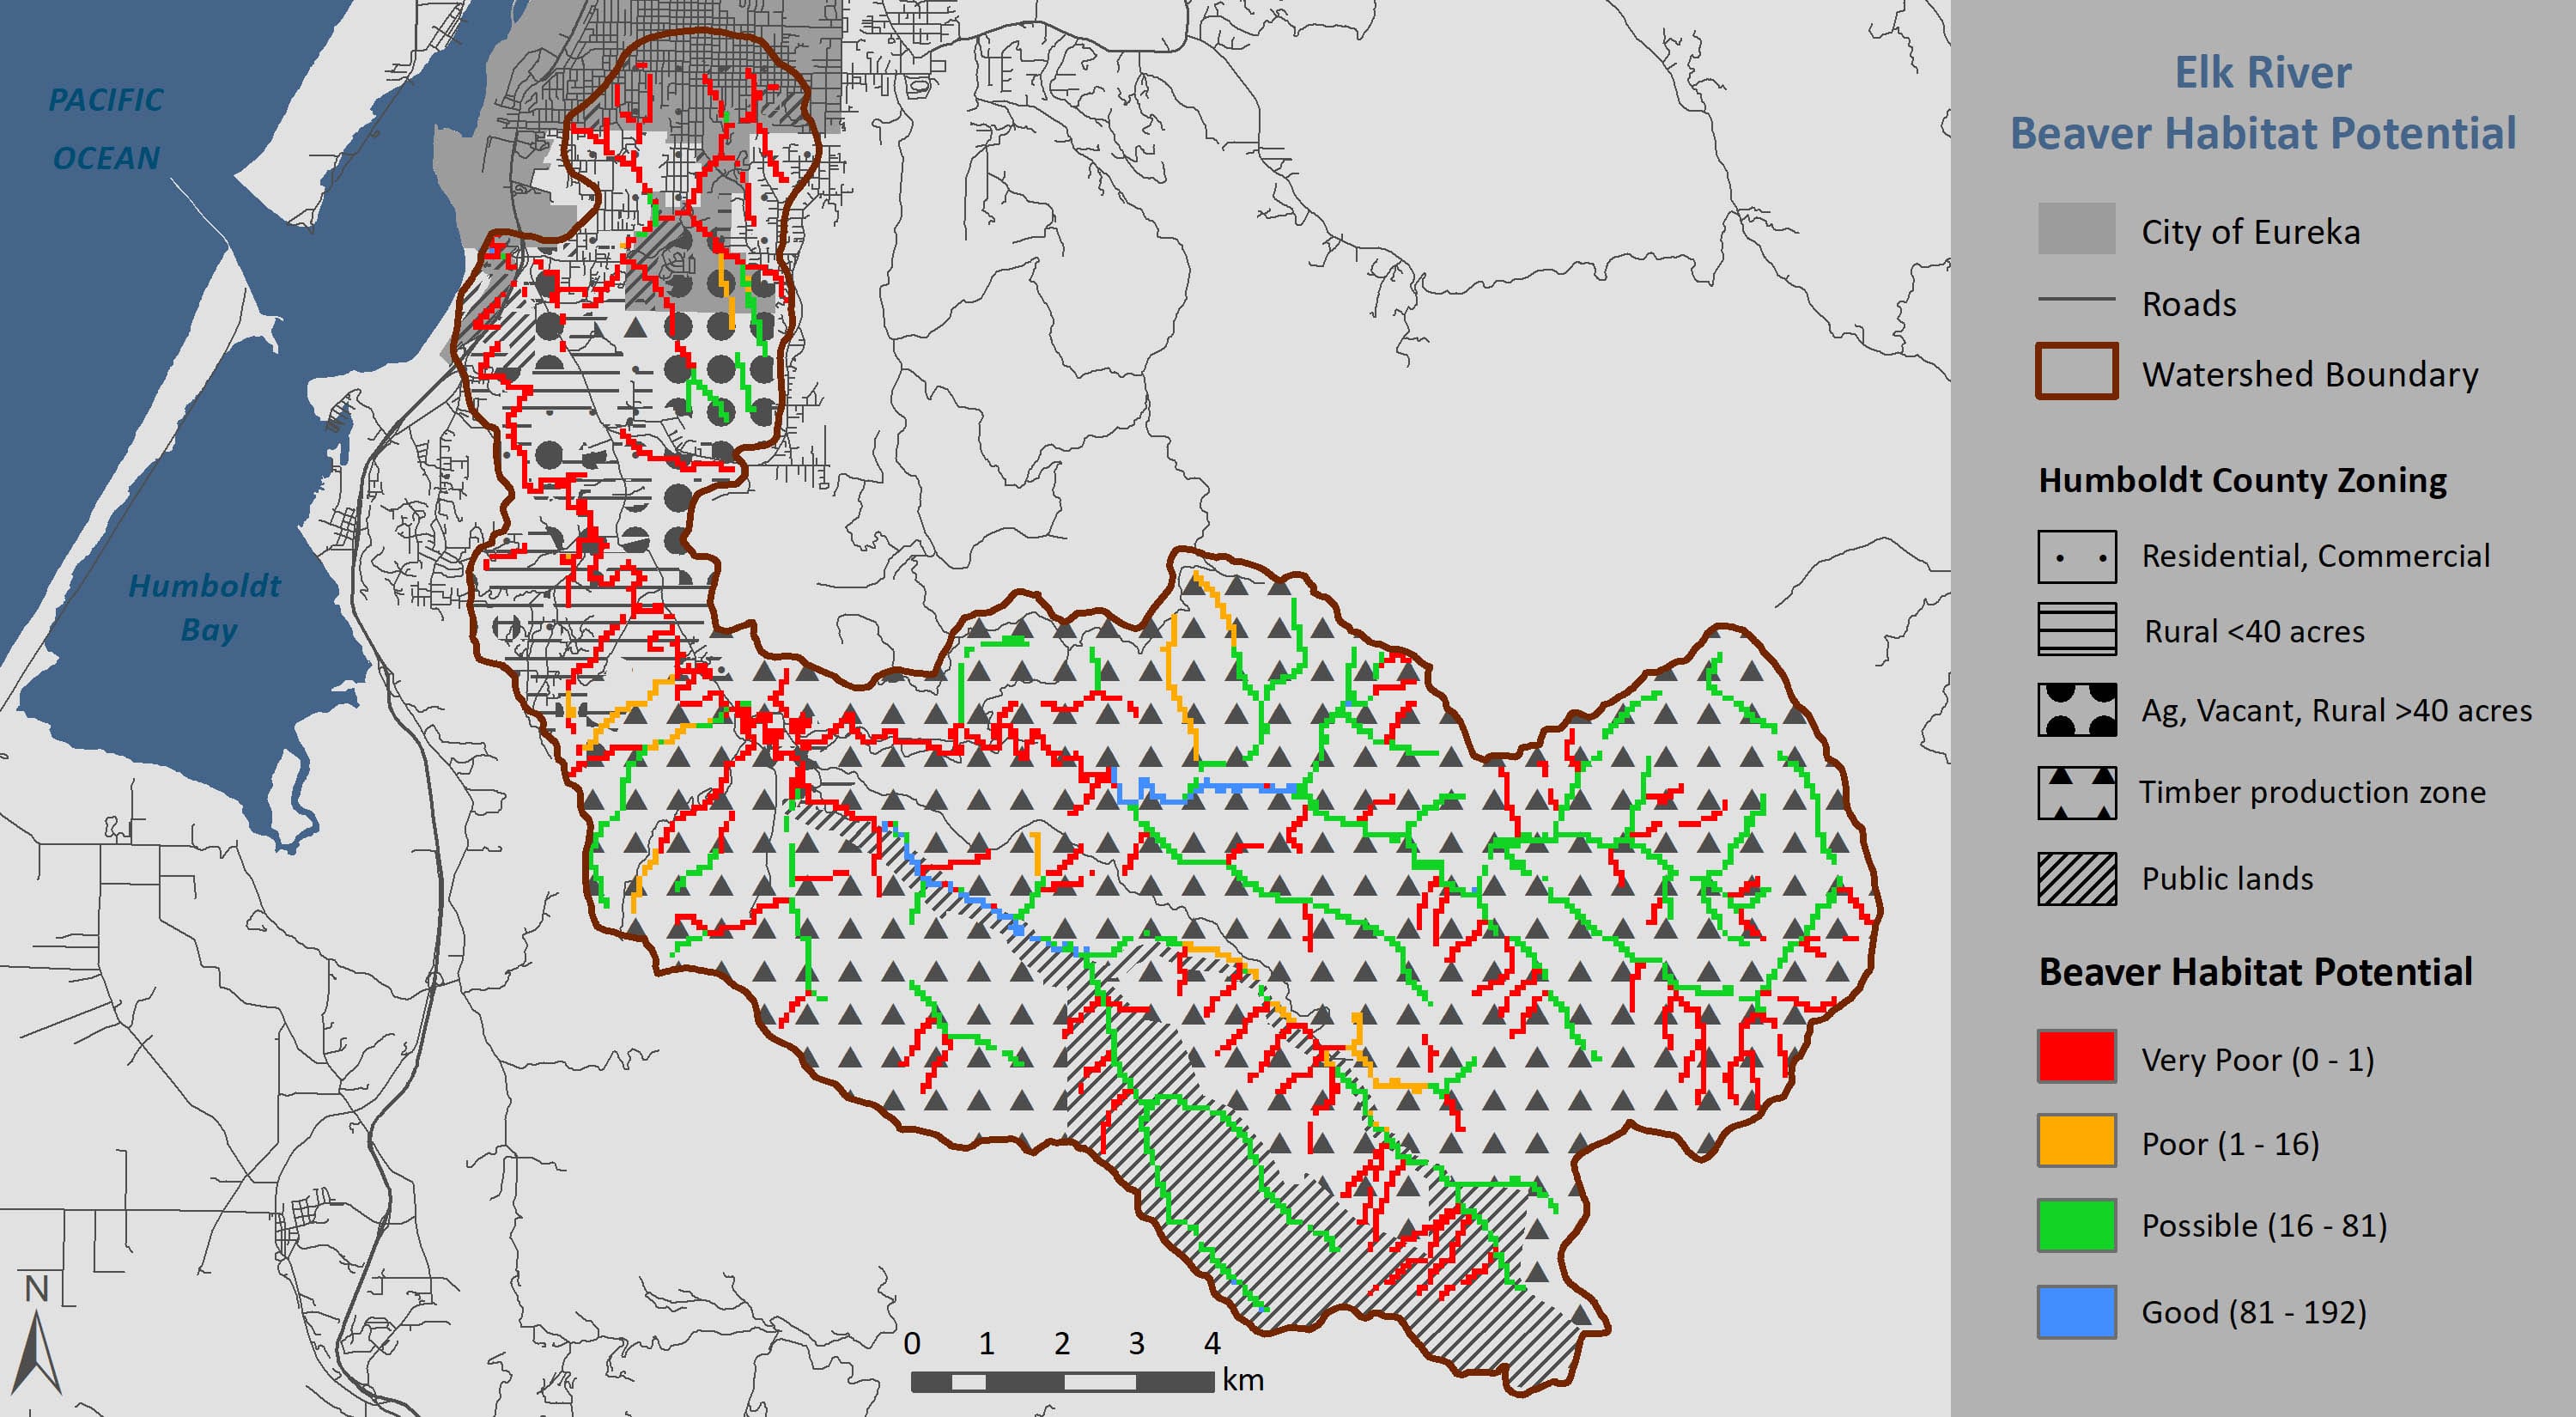
I used my final projects to deepen my understanding of hydrology and North Coast rivers, so I’ve mapped sea level rise on Humboldt Bay, conducted a longitudinal analysis of the vegetation changes on Cannibal Island, and constructed maps of intrinsic potential for salmon on Cedar Creek. As I write this, I am working on an analysis of beaver habitat on the Elk River, as well as an atlas of the Elk River watershed in various map styles, including a faux blueprint.
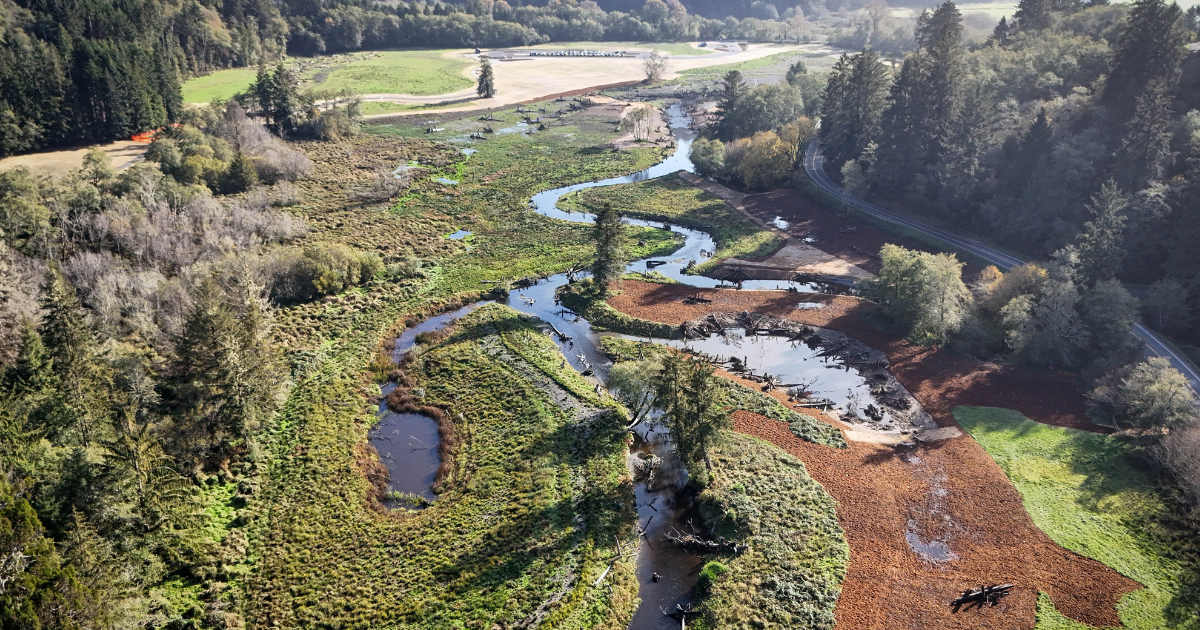
I’ve also had many opportunities to use my new skills at CalTrout, including working up a large-scale map of the mighty Eel River basin. But the work that really showed the power of having in-house mapping is with the Redwood Creek Estuary project. Building on work started by Redwood National Park, I worked with Darren and program manager Mary Burke to map out potential restoration actions, such as levee removal and excavation, in this estuary.
These maps provided a point of reference for CalTrout, landowners, and stakeholders to discuss the project. Coming together around a map, even virtually, provides a point of focus for a group to plan a project, and facilitates communication.
This was an iterative process, and I was able to produce multiple versions of the map reflecting the needs of the various stakeholders, which were then used to advance consensus and project planning. Having the capacity to produce map versions quickly helped move the conversation forward. The project is ongoing, so we can’t share these maps here, which is a relief as they are not my most aesthetically pleasing work, but certainly the most useful so far.
Learning GIS has been an incredible adventure. It’s also been challenging, putting in 20+ hours a week into coursework on top of working, living, and, well, surviving a pandemic.
Thank you to Darren for opening the door, to all the staff at CalTrout and especially the North Coast for listening and supporting, and especially to RLF for tuition funding. I look forward to continuing to make maps to advance to California Trout’s amazing work!
Raine Leblanc (they/them) is the project assistant in CalTrout’s North Coast Region.
Here are some other maps Raine has made: