

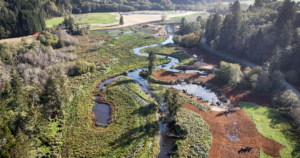

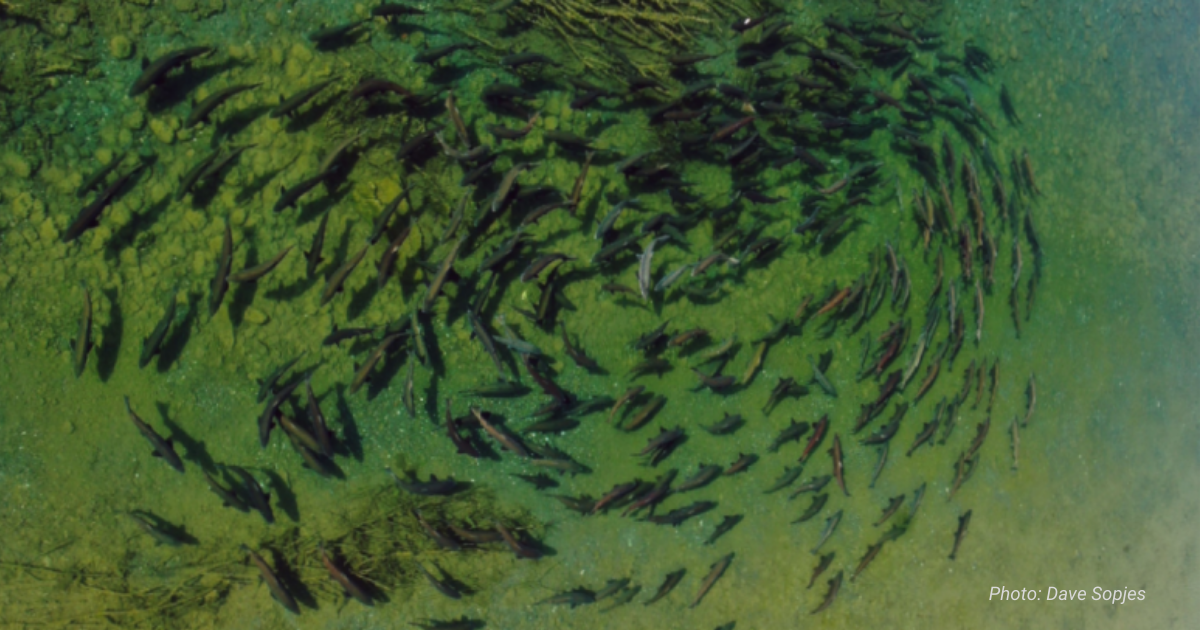
“Times are changing in the world of salmon assessment on the Eel River as technology provides more accurate counts than people can, with sonar in the river and drones in the sky.” (Redheaded Blackbelt)
While salmon counts are low this year, having accurate information will better inform our conservation efforts.
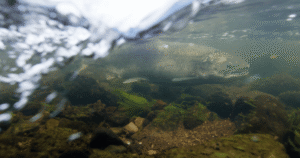
CalTrout has been using a Sonar system to estimate abundance of spawning Chinook Salmon, Coho Salmon, and steelhead on the South Fork Eel River with support from the California Department of Fish and Wildlife (CDFW) Steelhead Report and Restoration Card Program.
The Sonar System (DIDSON) located 10 miles above the South Fork confluence with the Eel River records video of fish as they migrate upstream to their spawning grounds. We estimated 2,190 Chinook Salmon passed the Sonar during November and December 2019 compared to 3,800 Chinook Salmon seen in November and December 2018.
A second DIDSON Sonar station operated by CDFW, is located nearby on the mainstem Eel River above its confluence with the South Fork Eel River. Operations at both of these sites began in 2018-19. Together, these two stations provide salmonid escapement data for a large portion of the Eel River. CDFW estimated that 4,110 Chinook salmon migrated up the mainstem Eel River between November and early January 2020, versus 3,844 the year prior.
While fish counts are low, but hopes are high.
North Coast Fisheries Scientist Matthew Metheny recounts his experiences in the field:
Unfortunately, our preliminary estimates for 2019-2020 are noticeably lower than last year’s. We estimated 2,190 Chinook Salmon passed the Sonar during November and December 2019 compared to the 3,800 Chinook Salmon seen in November and December 2018. The preliminary estimates for Coho salmon and steelhead during the months of January and February 2020 are a little better, at about 2/3 of the count for January and February 2019. Although the 2019-20 sonar deployment site is 9 river miles upstream of the 2018-19 site, we expect this year’s lower estimates are not due to the location change, but reflect a change in the run sizes.
The recent Sonar counts are well below recovery targets set for each species (Chinook, Coho, steelhead). Although the outlook isn’t great, there is reason for some hope. In the past, Benbow Damfish counts fell sharply in response to the 1954 and 1964 floods on the South Fork Eel River; yet the populations were eventually able to return in stronger numbers. The amazing resilience of salmon and steelhead means that we still have the capacity to rebuild these populations, if we act wisely.
Here’s a weekly count comparison with last year. With a late start to the rainy season in both years of operation, the first pulse of fish makes up a large portion of the total run. Information like this is key to understanding the fish we’re trying to save.
Table 1. Comparison of weekly passage estimates of salmonids over 40cm total length for the South Fork Eel River. Estimates for the 2019-20 season are preliminary. A “*” indicates an 8-day Julian week; a “**” indicates an 8-day Julian week in leap years.
Further Reading
Redheaded Blackbelt. “Fall Chinook Salmon Run in Eel River Estimated to have Dipped Below 10,000 Fish for the First Time Science ERRP Began Assessments in 2012.” April 17th, 2020