Aquatic Species Assessment Tool (ASAT)
Home | Key Initiatives | Restore Estuaries | Aquatic Species Assessment Tool (ASAT)
Project Goal:
The Aquatic Species Assessment Tool (ASAT) will provide an integrated quantitative framework for assessing the impact of management actions on salmonids and other sensitive listed fish species that depend on the estuary for their lifecycle.
Learn More
Project Stages
Planning
Conceptual Design
Implementation
Completion
Estimated Completion Date:
2023
Region:
Project Funders
Wildlife Conservation Board
Tides Foundation
Keefe Foundation
Resources Legacy Fund
Orange County Community Foundation

Project Description
CalTrout's Restore Estuaries initiative includes an inter-regional collaboration among the North Coast, Bay Area, and San Diego staff called the Aquatic Species Assessment Tool (ASAT).
Working with an experienced technical advisory committee, habitat modelers at CSU Monterey Bay, and food web researchers at UC Berkeley, CalTrout is developing an estuary restoration planning tool for managers. The proposed tool provides a species-focused estuary assessment and design tool to enhance biodiversity and sustain ecosystem resilience to the impacts of climate change and sea level rise in estuaries across California. The ASAT tool will allow managers to to identify and help resolve potential habitat trade-offs of different listed fish species based on their physiological requirements in estuaries. The guidelines and best management practices will provide a useful framework for managers, regulatory agencies, restoration practitioners, and others to understand the seasonal estuarine habitat needs of each species and to help make informed decisions to manage tradeoffs. CalTrout contracted Dr. John Olson’s group at CSU-Monterey Bay to model aquatic species’ abundance in select estuaries to better understand key variables that drive population dynamics in these ecosystems. Dr. Olson and students Michelle Tarian, Mike Biedebach and Caleb Yakel used Random Forest modeling to analyze existing robust data sets in four representative estuaries: Russian River, Redwood Creek, Carmel River, and Suisun Estuaries to understand drivers and trade-offs in different sizes and classes of estuaries. They also generated a prototype interface for the models that let users predict how different scenarios (e.g., increased summer flows or increased temperatures) likely affect the abundances of each species in their estuary of interest. Getting sufficient population data was critical to successful modeling, and will hopefully highlight the need for additional monitoring data to do these sorts of analysis that are fundamental to resource management.Project Partners:
University of California, Berkeley
California State University at Monterey Bay
Technical Advisory Committee
ASAT end-users
More Initiative Projects
String of Pearls
Central Valley
The String of Pearls is a comprehensive effort to increase both the pace and scale of floodplain restoration in the Sacramento Valley.
Learn MoreScott River Restoration and Flow Enhancement Project
Mt. Shasta-Klamath
Promote functioning ecosystems and sustainable water supplies for the Scott Valley through innovative and cooperative solutions. Restore salmon habitat, enhance fish passage, and reduce impacts from...
Learn MoreBig Chico Creek Watershed Planning
Improve migratory fish passage for steelhead, spring-run Chinook salmon, and other native in the lower reaches of the Big Chico Creek watershed.
Learn MoreIntegrating Meadow and Forest Restoration for Quantifiable Carbon, Water, Wildlife, and Energy Benefits in the Glass Mountains
Sierra Headwaters
Restore over 300 acres within 7 subalpine meadows and historic Sierra Nevada Yellow Legged Frog habitat in the desert-forest transition zone of the Eastern Sierra. ...
Learn MoreSouthern Steelhead Coalition
South Coast
The Coalition’s goal is to increase the pace, scale, and scope of watershed restoration projects leading to resilient Southern steelhead populations in
Tracking the Repopulation of Fishes after Dam Removal on the Klamath River
Mt. Shasta-Klamath
Monitor fish migration following dam removal and assess the efficacy of this monumental restoration effort to build our understanding of
Upper Sacramento Basin Source Waters Science Study
Mt. Shasta-Klamath
Provide a scientifically based toolset to better understand, manage, and advance the protection of the cold, clean spring waters in the Upper Sacramento Basin.
Learn MoreLahontan Cutthroat Trout Recovery
Sierra Headwaters
Recover Lahontan cutthroat trout populations in their native range.
Learn MoreTruckee River Bank Stabilization and Angler Access
Sierra Headwaters
Provide a stabilized channel access point for anglers, boaters, and other recreational users, reduce sediment delivery to the Truckee River, and restore native riparian vegetation. A defined access...
Learn MoreSunol Valley Fish Passage Project on Alameda Creek
Bay Area
Restore consistent access for salmonids to upper Alameda Creek and open more than 20 miles of stream to Chinook salmon, steelhead, and other native fishes such as lamprey.
Learn MoreSierra Meadows Partnership and Public Outreach
Sierra Headwaters
Realize the restoration potential of the Sierra Nevada using a holistic rubric and inclusive process.
Learn MoreRedwood Creek Estuary Restoration
North Coast
Reestablish hydraulic, sediment transport, and floodplain processes necessary to restore and sustain ecological function in lower Redwood Creek. Recover threatened salmonid species including Southern...
Learn MoreWalker Creek Outreach & Education Program
Bay Area
Work with partners to inspire the next generation of environmental stewards through stream study focused on watershed health and endangered coho salmon recovery at Walker Creek Ranch in Marin County.
Learn MoreEast Fork Scott River Restoration
Mt. Shasta-Klamath
Reconnect historic floodplains and enhance aquatic habitat on 6.7 miles of the East Fork Scott River and its tributaries; Restore fish passage to 1.4 miles of cold-water tributary Big Mill Creek;...
Learn MoreBy-Day Creek Forest Health Project
Sierra Headwaters
Improve forest ecosystem health and minimize the impacts of future wildfires.
Learn MoreBull Creek Hamilton Reach Instream and Floodplain Habitat Restoration
North Coast
Restore and protect important riparian, instream, floodplain and side-channel habitat in Bull Creek, which supports four anadromous fish species, Coho and Chinook Salmon, Steelhead, and Pacific...
Learn MoreBig Chico Creek – Iron Canyon Fish Passage Project
Restore access for steelhead and spring-run Chinook salmon to the entirety of their historical distribution in Big Chico Creek, resulting in an expected 8.5 miles of additional anadromous habitat.
Learn MoreEvans Spring Flow Restoration to Little Shasta River
Mt. Shasta-Klamath
Restore Evan's Spring flow to the Little Shasta River and improve summer conditions for juvenile rearing among native fish. Ultimately, reconnect the Little Shasta River to the Shasta River at...
Learn MoreKlamath Basin Water Project
Mt. Shasta-Klamath
Enhance flows and improve critical instream habitat for coho and Chinook salmon throughout the watershed.
Learn MoreEel River Restoration Plan
North Coast
Efficiently restore native anadromous fish populations and ecological processes across the Eel River watershed.
Learn MoreWalker Creek Coho Salmon Research and Monitoring
Bay Area
Assess streamflows, water temperatures, habitat usage, and migration of adult and juvenile tagged coho salmon in Walker Creek to identify factors potentially limiting their recovery. We will use this...
Learn MoreAlameda Creek Fisheries Monitoring
Bay Area
Work with partners to fill key data gaps in monitoring Alameda Creek tributaries to inform future management and restoration to assist recovery of steelhead and Chinook salmon in the watershed.
Learn MorePescadero and Butano Creek Fish Tracking
Bay Area
As part of an expansion to research on Pescadero Creek, a PIT antenna on Butano Creek will track steelhead and coho salmon on their annual spawning runs and will provide us with important information...
Learn MoreCannibal Island Restoration
North Coast
Restore the 950-acre tidal marsh estuary surrounding Cannibal Island, adjacent to the mouth of Eel River.
Learn MoreSanta Margarita River – Sandia Creek Fish Passage
South Coast
Remove a high priority fish passage barrier, improve trail user experience and safety, protect the public from flood impacts, and increase the quality of riparian and river habitat for multiple...
Learn MoreNative Rainbow Trout Refugia Mapping
South Coast
To prepare a list of ground-truthed refugia habitat locations for trout relocated after wildfire and during large So Cal fish passage projects.
Learn MoreFloodplain Forward Coalition
Central Valley
Reconnect fish with the food and provide them a safe haven.
Learn MoreScott River South Fork – Floodplain and Instream Restoration
Mt. Shasta-Klamath
To restore the prime nursery habitat for juvenile salmon on the South Fork Scott River.
Learn MoreBattle Creek – Eagle Canyon Fish Passage Project
Open access to more than 8 miles of spring-fed spawning and rearing habitat for Sacramento River winter-run Chinook salmon, steelhead trout, and other native migratory fishes by removing a fish...
Learn MoreCochran Creek Fish Passage and Channel Restoration
North Coast
Allow fish passage into Cochran Creek to help sustain populations of coho, steelhead, and coastal cutthroat trout, while enhancing and expanding productive tidal, brackish, freshwater, and riparian...
Learn MoreScott Valley Sustainable Groundwater Management
Participate in the Scott Valley SGMA process and advocate for a Groundwater Sustainability Plan (GSP) that protects interconnected surface waters for the benefit of fish and wildlife
Learn MoreParks Creek Cardoza Ranch Fish Passage and Flow Enhancement
Mt. Shasta-Klamath
Enhance flows and restore critical spawning and rearing habitat for salmon and steelhead throughout the watershed.
Learn MoreEel River Forum
North Coast
Achieve consensus among a coalition of agency, tribal, and conservation partners regarding priority recovery actions and policy reform needed to recover salmonid populations in the Eel River basin,...
Learn MoreCentral Valley Salmon Habitat Partnership
Central Valley
Through science-based objectives and prioritized actions to implement them, the Salmon Partnership will advance recovery and maintenance of viable, self-sustaining spring-run and winter-run Chinook...
Learn MoreMill-Shackleford Bridge Fish Passage Restoration
Mt. Shasta-Klamath
This project addresses Watershed Restoration Grant Program Funding Priority 3: Protect and Restore Anadromous Fish Habitat. Specifically, the project will result in 1) the removal of a human‐caused...
Learn MoreAdult Salmonid Sonar Monitoring Program
North Coast
Obtain baseline data on steelhead entering the South Fork Eel River to spawn in order to inform the angling public on steelhead abundance. Determine if sonar assessment of adult salmonids is an...
Learn MoreAquatic Species Assessment Tool (ASAT)
North Coast
South Coast
Bay Area
The Aquatic Species Assessment Tool (ASAT) will provide an integrated quantitative framework for assessing the impact of management actions on salmonids and other sensitive listed fish species that...
Learn MoreHighway 76 – Pauma Creek Fish Passage
South Coast
Remove the only total fish passage barrier between a robust rainbow trout population in Pauma Creek and the Pacific ocean.
Learn MoreHarvey Diversion Fish Passage
South Coast
Restore passive fish passage at this location and stabilize sediment transport through this reach.
Learn MoreSanta Clara River Floodplain Restoration
South Coast
Restoration of floodplain processes by focusing on the removal of non-native, invasive plants and revegetation with native species to reestablish critical habitat for sensitive species and riparian...
Learn MoreI-5 Trabuco Creek Fish Passage Project
South Coast
Enable steelhead passage through this total barrier at the Interstate 5 bridge array on Trabuco Creek and provide access to 15 miles of upstream high quality spawning and rearing habitat. Trabuco...
Learn MoreMalibu Creek Ecosystem Restoration Project
South Coast
Remove the defunct Rindge Dam location in Malibu Creek canyon. ...
Learn MoreMatilija Dam Removal
South Coast
Support the Matilija Coalition, Ventura County Watershed Protection District and U.S. Army Corps of Engineers in securing funding to finalize a dam removal design and associated re-evaluation of...
Learn MoreSouthern Steelhead Coalitions
South Coast
CalTrout leads two Southern California steelhead coalitions with the goal to increase the pace, scale, and scope of watershed restoration projects leading to resilient Southern steelhead populations...
Learn MoreSanta Margarita Ecological Reserve Steelhead Habitat Improvement
South Coast
This project will improve steelhead habitat in the Santa Margarita River through non-native aquatic species removal, invasive vegetation removal and sediment reduction.
Learn MoreNative Rainbow Trout Subpopulation Expansion Plan
South Coast
The management of non-native aquatic species addressees a major threat to the survival of native trout. Management is arduous and expensive, but worth the long-term investment to clear prime habitat...
Learn MoreWF San Luis Rey Native Trout Protection
South Coast
The goal of this project is to protect one of the last and most southern native rainbow trout populations of steelhead lineage in Pacific coast of United States.
Learn MoreSan Mateo Creek Non-Native Removal
South Coast
The goal of this project is to remove non-native species that are detrimental to native trout survival in San Mateo Creek, in federally designated critical habitat for endangered Southern California...
Learn MoreRose Valley Creek Stream Restoration Project
South Coast
To develop an alternative analysis for the restoration of Southern California steelhead in the Rose Valley Lakes System and Sespe Creek Watershed.
Learn MoreSierra Meadows Wetland and Riparian Area Monitoring
Sierra Headwaters
Develop and implement the first Sierra Meadows Wetland and Riparian Area Monitoring Plan (SM-WRAMP). The SM-WRAMP will provide an authoritative and collaborative approach to monitoring meadow...
Learn MoreKern River Watershed Native Rainbow Trout Recovery Plan
Sierra Headwaters
Apply the Sierra Meadow Strategy approach to establish a prioritized inventory of meadow restoration activities providing maximum habitat benefit for listed Kern River rainbow trout, amphibian, and...
Learn MoreOsa Meadow Research and Restoration
Sierra Headwaters
Create greater ecological resilience of Osa Meadow to combat climate change and other stressors and promote recovery of Kern River rainbow trout populations. Study the cause-and-effect of meadow...
Learn MorePrioritizing and Restoring Sierra Meadows
Sierra Headwaters
Restore 30,000 meadow acres in the Sierra Nevada by 2030.
Learn MoreJune Mountain Forest Health Project
Sierra Headwaters
Protect the water resources that sustain wild trout and provide drinking water by removing dying trees across 518 acres of National Forest System lands. Remove excessive dead wood, implement...
Learn MoreOwens River Protection
Sierra Headwaters
Seeking full implementation of the water agreement settlement terms: a) the Fisheries Enhancement Fund is active and functioning, (b) instream flow requirements are met, and (c) fully appropriated...
Learn MoreMono Basin Protection
Sierra Headwaters
Restore the long-term ecological health of the Mono Basin tributaries and Mono Lake.
Learn MoreKlamath Dams Removal
Mt. Shasta-Klamath
Recover Klamath River salmonid populations by removing 4 dams on the Klamath River (Iron Gate, Copco 1, Copco 2, and JC Boyle) and opening up fish passage to over 400 miles of potential spawning and...
Learn MoreLittle Shasta River Flow Enhancement Project
Mt. Shasta-Klamath
Improve irrigation infrastructure on the 4,500-acre Hart Ranch and enable this key landowner to dedicate meaningful water savings back into the Little Shasta River for the benefit of salmon and other...
Learn MoreScott Bar Fish Passage
Mt. Shasta-Klamath
Restore access for threatened coho salmon, steelhead, and other aquatic species to approximately three miles of year-round, cold water spawning and rearing habitat on Scott-Bar Mill Creek in the...
Learn MoreScott River Restoration
Mt. Shasta-Klamath
Recover salmonid populations in the Scott River, a key mid-Klamath River tributary and nursery, by restoring spawning and rearing habitat, in-stream flows, water quality, and other ecological...
Learn MoreShasta River and Parks Creek Restoration
Mt. Shasta-Klamath
Recover salmonid populations in the Shasta River, a key mid-Klamath River tributary and nursery, by restoring spawning and rearing habitat, in-stream flows, water quality, and other ecological...
Learn MoreFall River Wild Trout Program
Mt. Shasta-Klamath
Protect CA’s largest spring-fed river, over 30 miles of wild and native trout habitat, and one million acre-feet per year of cold, clean volcanic source water that provides habitat for native fish...
Learn MoreMcCloud River Protection
Mt. Shasta-Klamath
Protect three miles of pristine salmon habitat on the Upper Sacramento and McCloud rivers (blue ribbon wild trout fisheries) from inundation.
Learn MoreHat Creek Restoration
Mt. Shasta-Klamath
Use large woody debris to restore 1.5 miles of instream habitat for the benefit of wild trout while helping protect cultural resources on over 5,000 acres of ancestral lands of the Illmawi Band of the...
Learn MoreBaduwa’t Estuary Restoration
North Coast
Restore key salmonid off-channel rearing habitat and provide public access enhancements. ...
Learn MoreCedar Creek Barrier Removal
North Coast
Restore migratory access to approximately 9 miles of salmon and steelhead habitat. Protect important cold water refugia in the South Fork Eel River.
Learn MoreWoodman Creek Project
North Coast
Remove the Northwestern Pacific Railroad barrier at the mouth of Woodman Creek and restore the historic channel-mouth configuration to allow unimpeded coho, Chinook, and steelhead access to 10-14...
Learn MoreEel River Dams License Renewal – Potter Valley Project
North Coast
Improve streamflows and reconnect Eel River salmon and steelhead with 288 miles of spawning habitat in the upper mainstem Eel River. Work with Regional Coalition partners (Sonoma Water, Mendocino...
Learn MoreElk River Recovery Program
North Coast
Recover the Elk River from current severe water quality and sediment impairment, nuisance flooding conditions, habitat degradation, salmonid population reduction and community strife that resulted...
Learn MoreSmith River Protection
North Coast
Raise awareness of the current threats to the pristine North Fork of the Smith River from international mining corporations.
Learn MorePrairie Creek Floodplain Restoration
North Coast
Restore floodplain habitat and create public access. ...
Learn MoreNorth Coast Science and Monitoring Program
North Coast
Gain a stronger technical understanding of salmon and steelhead recovery efforts through establishing a research and monitoring program in the South Fork Eel River.
Learn MoreFloodplain Salmon Habitat Credit Development
Central Valley
Develop on-farm water management practices that benefit native fish species and the aquatic ecosystems on which they depend for use in agriculture conservation incentive programs.
Learn MoreFlood Infrastructure Retrofits
Central Valley
Retrofit flood infrastructure in the Tisdale and Sutter bypasses to enhance fish passage; improve water use efficiency; create floodplain rearing habitat for endangered salmonids; and increase...
Learn MoreNigiri Project
Central Valley
Scientifically demonstrate that productivity created by shallow inundation of floodplains is foundational to supporting self-sustaining populations of fish and wildlife in the Central Valley.
Learn MoreSearsville Dam Fish Passage
Bay Area
Ensure long-term passage for juvenile and adult steelhead in San Francisquito Creek beyond Searsville Dam on San Francisquito Creek by working with Stanford University, resource agency, non-profit,...
Learn MoreFish Food on Floodplain Farm Fields
Central Valley
Bring together farmers, conservationists, universities, and state and federal agencies to demonstrate innovative solutions for reintegrating fish food created in floodplain wetlands back to the river...
Learn MoreSecuring South Bay Stream Flows for Steelhead
Bay Area
Ensure adequate streamflows are returned to key South Bay streams and necessary habitat improvements are completed as expeditiously as possible through a long-standing settlement agreement and...
Learn MoreBay Area Outreach and Education
Bay Area
Increase outreach overall to youth, members, fly clubs, and others about our efforts in the Bay Area and statewide.
Learn MoreFeatured News
array(2) {
  [0]=>
  string(8) "Planning"
  [1]=>
  string(17) "Conceptual Design"
}
array(1) {
  [0]=>
  string(14) "Implementation"
}
 Human use of streams, lakes, and surrounding watersheds for recreation has greatly increased with population expansion. Boating, swimming, angling, off-road vehicles, ski resorts, golf courses and other activities or land uses can negatively impact salmonid populations and their habitats. The impacts are generally minor; however, concentration of multiple activities in one region or time of year may have cumulative impacts.


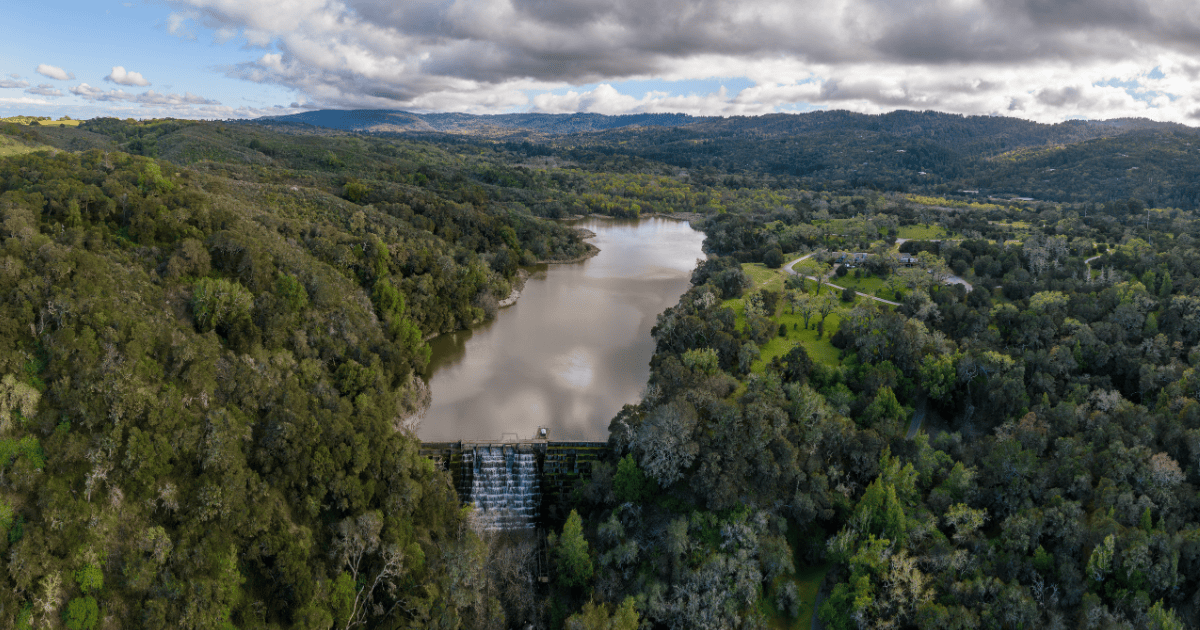
 Dams block access to historical spawning and rearing habitats. Downstream, dams alter the timing, frequency, duration, magnitude, and rate of change of flows decreasing habitat quality and survival.